大体でIT
大体でIT
Excel VBAで、グラフや系列の「種類」を変更する方法について、ご紹介します。グラフの種類を変更するには、「.ChartType」を使います。一部の系列のみ種類を変更したい場合は、「SeriesCollection(系列の番号)」で系列を指定して変更します。
この記事では、グラフや系列の種類を変更する方法について、ご紹介します。
グラフの種類を変更するには、「.ChartType」を使います。
一部の系列のみ種類を変更したい場合は、「SeriesCollection(系列の番号)」で系列を指定して、種類を変更しましょう。
では、グラフや系列の種類を変更する方法について、解説していきます。
グラフや系列の種類を変更するVBAコードについて、まとめています。
VBAコードだけ確認したい場合に、ご活用ください。
'グラフ種類を変更
ActiveSheet.ChartObjects(1).Chart.ChartType = xlColumnClustered  '集合縦棒

'「系列」のグラフ種類を変更
ActiveSheet.ChartObjects(1).Chart.SeriesCollection(4).ChartType = xlLine '「4つ目の系列」を折れ線グラフにする
グラフ種類の変更は、「ChartType」を使います。
'グラフ種類を変更
ActiveSheet.ChartObjects(1).Chart.ChartType = グラフの種類
「集合縦棒」なので「xlColumnClustered」を入力します。
Sub TEST2()

    'グラフ種類を変更
    ActiveSheet.ChartObjects(1).Chart.ChartType = xlColumnClustered  '集合縦棒

End Sub
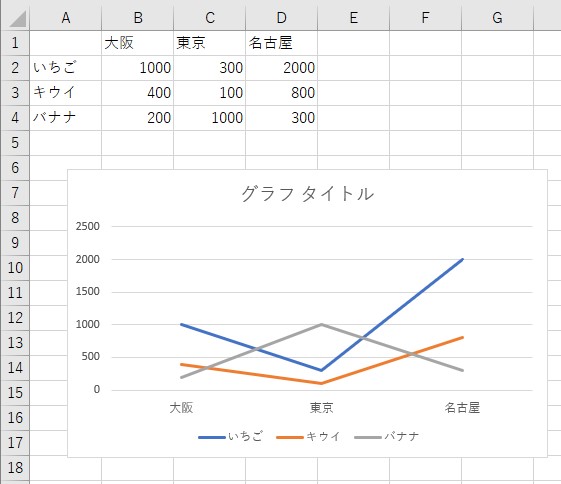
元グラフ
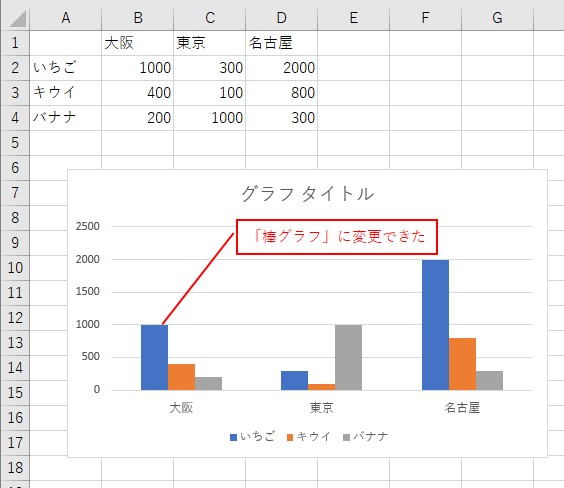
「棒グラフ」に変更できた
SeriesCollectionとChartTypeを使う
系列を変更したいので「SeriesCollection」で「系列の番号」を指定して、「ChartType」でグラフ種類を設定します。
'系列の単位でグラフ種類を変更
ActiveSheet.ChartObjects(1).Chart.SeriesCollection(系列の番号).ChartType = グラフの種類
系列のイメージについて、詳細はこちらでまとめています。
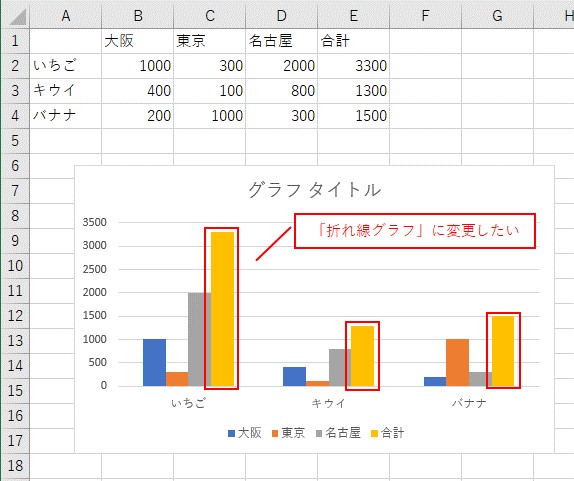
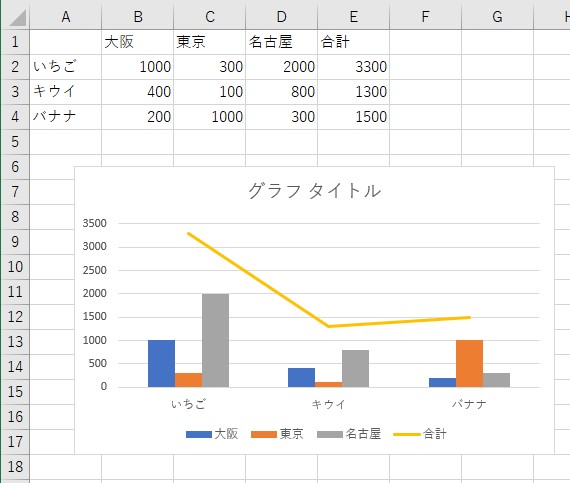
「4つ目」の系列を「折れ線グラフ」に変更してみます。
折れ線グラフなので、「xlLine」を入力します。
Sub TEST4()

    '「4つ目」の系列
    With ActiveSheet.ChartObjects(1).Chart.SeriesCollection(4)
        'グラフ種類を変更
        .ChartType = xlLine  '折れ線グラフ
    End With

End Sub
元グラフ
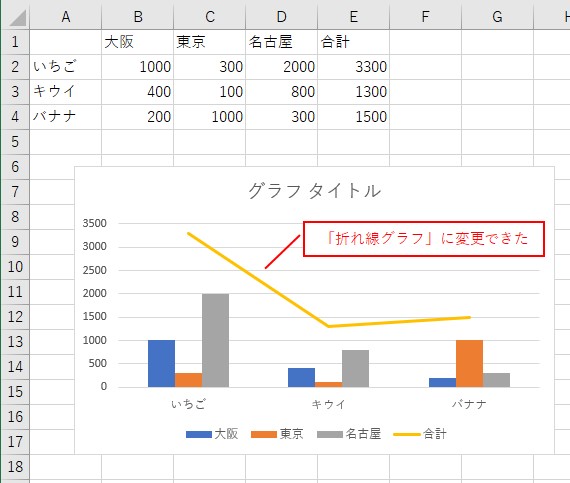
「系列」を折れ線グラフに変更できた
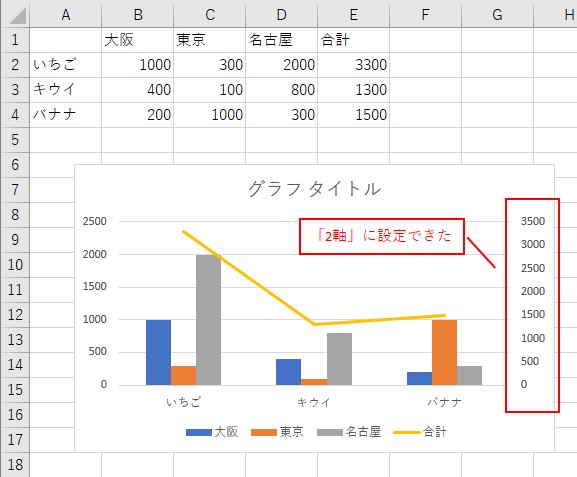
先ほどの例で、系列の種類を変更する場合は、「2軸」に設定するとグラフが見やすくなります。
「2軸」に設定する場合は、「.AxisGroup = 2」とします。
Sub TEST5()

    '「4つ目」の系列
    With ActiveSheet.ChartObjects(1).Chart.SeriesCollection(4)
        .AxisGroup = 2  '第2軸にする
    End With

End Sub
元グラフ
「2軸」を設定できた
系列の種類を変更する場合は、「2軸」の設定もしましょう。
グラフで2軸を設定する方法について、詳細はこちらでまとめています。
縦棒グラフの種類
- 集合縦棒(xlColumnClustered)
- 積み上げ縦棒(xlColumnStacked)
- 100% 積み上げ縦棒(xlColumnStacked100)
- 3-D 集合縦棒(xl3DColumnClustered)
- 3-D 積み上げ縦棒(xl3DColumnStacked)
- 3-D 100% 積み上げ縦棒(xl3DColumnStacked100)
- 3-D 縦棒(xl3DColumn)
'「縦棒グラフ」の種類
ActiveChart.ChartType = xlColumnClustered '集合縦棒
ActiveChart.ChartType = xlColumnStacked '積み上げ縦棒
ActiveChart.ChartType = xlColumnStacked100 '100%  積み上げ縦棒
ActiveChart.ChartType = xl3DColumnClustered '3-D 集合縦棒
ActiveChart.ChartType = xl3DColumnStacked '3-D 積み上げ縦棒
ActiveChart.ChartType = xl3DColumnStacked100 '3-D 100% 積み上げ縦棒
ActiveChart.ChartType = xl3DColumn '3-D 縦棒
横棒グラフの種類
- 集合横棒(xlBarClustered)
- 積み上げ横棒(xlBarStacked)
- 100% 積み上げ横棒(xlBarStacked100)
- 3-D 集合横棒(xl3DBarClustered)
- 3-D 積み上げ横棒(xl3DBarStacked)
- 3-D 100% 積み上げ横棒(xl3DBarStacked100)
'横棒グラフの種類
ActiveChart.ChartType = xlBarClustered '集合横棒
ActiveChart.ChartType = xlBarStacked '積み上げ横棒
ActiveChart.ChartType = xlBarStacked100 '100% 積み上げ横棒
ActiveChart.ChartType = xl3DBarClustered '3-D 集合横棒
ActiveChart.ChartType = xl3DBarStacked '3-D 積み上げ横棒
ActiveChart.ChartType = xl3DBarStacked100 '3-D 100% 積み上げ横棒
折れ線
- 折れ線(xlLine)
- 積み上げ折れ線(xlLineStacked)
- 100% 積み上げ折れ線(xlLineStacked100)
- マーカー付き折れ線(xlLineMarkers)
- マーカー付き積み上げ折れ線(xlLineMarkersStacked)
- マーカー付き 100% 積み上げ折れ線(xlLineMarkersStacked100)
- 3-D 折れ線(xl3DLine)
'「折れ線」の種類
ActiveChart.ChartType = xlLine '折れ線
ActiveChart.ChartType = xlLineStacked '積み上げ折れ線
ActiveChart.ChartType = xlLineStacked100 '100  積み上げ折れ線
ActiveChart.ChartType = xlLineMarkers 'マーカー付き折れ線
ActiveChart.ChartType = xlLineMarkersStacked 'マーカー付き積み上げ折れ線
ActiveChart.ChartType = xlLineMarkersStacked100 'マーカー付き 100% 積み上げ折れ線
ActiveChart.ChartType = xl3DLine '3-D 折れ線
散布図
- 散布図(xlXYScatter)
- 散布図(平滑線とマーカー)(xlXYScatterSmooth)
- 散布図(平滑線)(xlXYScatterSmoothNoMarkers)
- 散布図(直線)(xlXYScatterLines)
- 散布図(直線とマーカー)(xlXYScatterLinesNoMarkers)
- バブル(xlBubble)
- 3-D効果付きバブル(xlBubble3DEffect)
'「散布図」の種類
ActiveChart.ChartType = xlXYScatter '散布図
ActiveChart.ChartType = xlXYScatterSmooth '散布図(平滑線とマーカー)
ActiveChart.ChartType = xlXYScatterSmoothNoMarkers '散布図(平滑線)
ActiveChart.ChartType = xlXYScatterLines '散布図(直線)
ActiveChart.ChartType = xlXYScatterLinesNoMarkers '散布図(直線とマーカー)
ActiveChart.ChartType = xlBubble 'バブル
ActiveChart.ChartType = xlBubble3DEffect '3-D効果付きバブル
円
- 円(xlPie)
- 3-D 円(xl3DPie)
- 補助円グラフ付き円(xlPieOfPie)
- 補助縦棒付き円(xlBarOfPie)
- ドーナツ(xlDoughnut)
'「円」の種類
ActiveChart.ChartType = xlPie '円
ActiveChart.ChartType = xl3DPie '3-D 円
ActiveChart.ChartType = xlPieOfPie '補助円グラフ付き円
ActiveChart.ChartType = xlBarOfPie '補助縦棒付き円
ActiveChart.ChartType = xlDoughnut 'ドーナツ
面
- 面(xlArea)
- 積み上げ面(xlAreaStacked)
- 100% 積み上げ面(xlAreaStacked100)
- 3-D 面(xl3DArea)
- 3-D 積み上げ面(xl3DAreaStacked)
- 3-D 100% 積み上げ面(xl3DAreaStacked100)
'「面」の種類
ActiveChart.ChartType = xlArea '面
ActiveChart.ChartType = xlAreaStacked '積み上げ面
ActiveChart.ChartType = xlAreaStacked100 '100% 積み上げ面
ActiveChart.ChartType = xl3DArea '3-D 面
ActiveChart.ChartType = xl3DAreaStacked '3-D 積み上げ面
ActiveChart.ChartType = xl3DAreaStacked100 '3-D 100% 積み上げ面
等高線
- 3-D 等高線(xlSurface)
- ワイヤーフレーム 3-D 等高線(xlSurfaceWireframe)
- 等高線(xlSurfaceTopView)
- ワイヤーフレーム等高線(xlSurfaceTopViewWireframe)
'「等高線」の種類
ActiveChart.ChartType = xlSurface '3-D 等高線
ActiveChart.ChartType = xlSurfaceWireframe 'ワイヤーフレーム 3-D 等高線
ActiveChart.ChartType = xlSurfaceTopView '等高線
ActiveChart.ChartType = xlSurfaceTopViewWireframe 'ワイヤーフレーム等高線
レーダー
- レーダー(xlRadar)
- マーカー付きレーダー(xlRadarMarkers)
- 塗りつぶしレーダー(xlRadarFilled)
'「レーダー」の種類
ActiveChart.ChartType = xlRadar 'レーダー
ActiveChart.ChartType = xlRadarMarkers 'マーカー付きレーダー
ActiveChart.ChartType = xlRadarFilled '塗りつぶしレーダー
作成したいグラフに応じて、ChartTypeに入力する値を選択しましょう。
この記事では、グラフや系列の種類を変更する方法について、ご紹介しました。
グラフの種類を変更するには、「.ChartType」を使います。
一部の系列のみ種類を変更したい場合は、「SeriesCollection(系列の番号)」で系列を指定して、種類を変更しましょう。
参考になればと思います。最後までご覧くださいまして、ありがとうございました。